mohg: Building and profiling a real-time synthesizer
I built mohg, a polyphonic synthesizer in Odin for macOS, to learn real-time audio and performance engineering. My initial 32-voice workload averaged 1.21 ms per block against a 1.33 ms budget. After adding more sound features and optimizing the renderer, it averaged 0.67 ms, about 45% less time. The main gains came from caching oscillator calculations, replacing tanh, and avoiding FIR outputs that would be discarded.
Individual blocks still exceeded the deadline even when the average used only half the budget. I’ll cover the optimizations first, then the experiments I ran to investigate those overruns.
The workload and deadline
I’m using an Arturia MiniLab 3 for MIDI input and an M4 MacBook Air. The benchmark renders 64-frame stereo blocks at 48 kHz, so each block represents 64 / 48,000 seconds of audio: 1.33 ms.
The main workload has 32 voices, each with 16 detuned oscillators and a nonlinear ladder filter, at 4x oversampling. A voice is one playing note; its oscillators combine to make that note’s sound. Oversampling runs the oscillators and filters four times per output frame to reduce aliasing.
I added features between optimization experiments, so their speedups don’t multiply into one overall result. Each before/after pair below compares the workload at that stage with and without one optimization.
Getting notes into the audio thread
I started by getting a sine wave to play using Apple’s AudioToolbox. CoreAudio calls my render callback with a buffer, and I fill it with the next samples before returning. If the callback runs late, you hear a glitch, so anything that can wait an unbounded amount of time (locks, allocation, blocking I/O) doesn’t belong on that thread.
After that, I used CoreMIDI to connect my keyboard. MIDIInputPortCreateWithProtocol takes an Objective-C block as its receive callback, and Odin procedures aren’t blocks, so I wrote a small C bridge. The block just captures my Odin procedure and a context pointer and calls it:
return MIDIInputPortCreateWithProtocol(
    client, portName, protocol, outPort,
    ^(const MIDIEventList *eventList, void *sourceContext) {
        receiveProc(eventList, context, sourceContext);
    });
The receive block runs on its own CoreMIDI thread, so now I had two threads touching the synth. I wanted the audio thread to own all of the live synth state. The MIDI callback decodes Note On, Note Off, and Control Change messages and copies them into a fixed-capacity single-producer/single-consumer (SPSC) queue, and the audio callback drains that queue before rendering each block.
SPSC means exactly one thread writes and one thread reads, which lets the queue be a circular array with two counters. The producer side is small enough to show in full:
tail := intrinsics.atomic_load_explicit(&q.tail, .Relaxed)
head := intrinsics.atomic_load_explicit(&q.head, .Acquire)
if tail - head == u64(N) {
    return false
}
q.buffer[tail & u64(N - 1)] = item
intrinsics.atomic_store_explicit(&q.tail, tail + 1, .Release)
return true
Only the producer changes tail, so it can read its own counter with relaxed ordering. It publishes the new tail with a release store, and the consumer reads it with an acquire load, which makes sure the event contents are visible before the consumer reads the slot. The consumer does the same thing with head, so the producer never reuses a slot that’s still being read. I turn a counter into an index with counter & (N - 1), which works because the capacity has to be a power of two. The MIDI queue holds 512 events.
If the queue is full, the push returns false instead of waiting. Right now the MIDI callback ignores that return value, so an overflow could drop a Note Off and leave a note stuck. That’s something I still need a policy for.
Envelopes
Turning a note on or off abruptly caused clicks because the sample value jumped. I first added short fades, then replaced them with an ADSR envelope (attack, decay, sustain, release). Each voice tracks its envelope stage and current amplitude.
Parameters from the knobs
I wanted to control the sound with the knobs, like cutting the highs by turning down the cutoff. If the parameters change while the audio thread is reading them, that’s a data race, and a mutex could block the audio thread and cause glitches. So I added a second SPSC queue for parameter events.
I didn’t want to copy and paste the MIDI queue, so I made the queue generic with Odin’s parametric polymorphism. Odin generates a concrete version for each type and capacity at compile time, so making the queue generic adds no runtime dispatch. I used tagged unions for the event types:
Parameter_Event :: union {
    Ladder_Filter_Cutoff_Event,
    Ladder_Filter_Resonance_Event,
    Ladder_Filter_Drive_Event,
}
Later I mapped the MiniLab’s knobs to cutoff, resonance, and drive. In the current MIDI path, the audio thread itself turns those Control Change messages into parameter events, so this particular use of the parameter queue doesn’t actually cross threads. The changes apply at block boundaries, and I haven’t added smoothing yet.
Polyphony and unison
For polyphony, each voice computes its own sample and the synth sums them. Each voice has its own envelope, amplitude, phase, and filters. I added a max_voices setting, and if you play more notes than that, the synth steals the oldest voice and gives it the new note. The voices live in a fixed-size array, and the oldest voice is just voices[0], so stealing was pretty straightforward. A voice stays in the pool until its release finishes, since it’s still audible after the key goes up.
Unison gives each voice several oscillators that share its envelope and filters but have slightly different tuning and phase. With sine waves, the detuned oscillators beat against each other, which is when two waves with very similar frequencies drift in and out of phase. It sounded like a flanger. I spread the oscillators across the stereo field with panning: I map a position between -1 and 1 to an angle and use its cosine and sine as the left and right gains. That meant keeping separate left and right samples, and since each channel now has a different input, each voice needs separate left and right filters too.
To debug a click without printing from the audio thread, I also added a telemetry path. The audio thread pushes small records (event kind, frame, voice ID, note, amplitude) into a 256-entry SPSC queue, and a normal-priority thread prints them. If the queue fills, the audio thread drops the record and counts the loss instead of waiting.
Aliasing
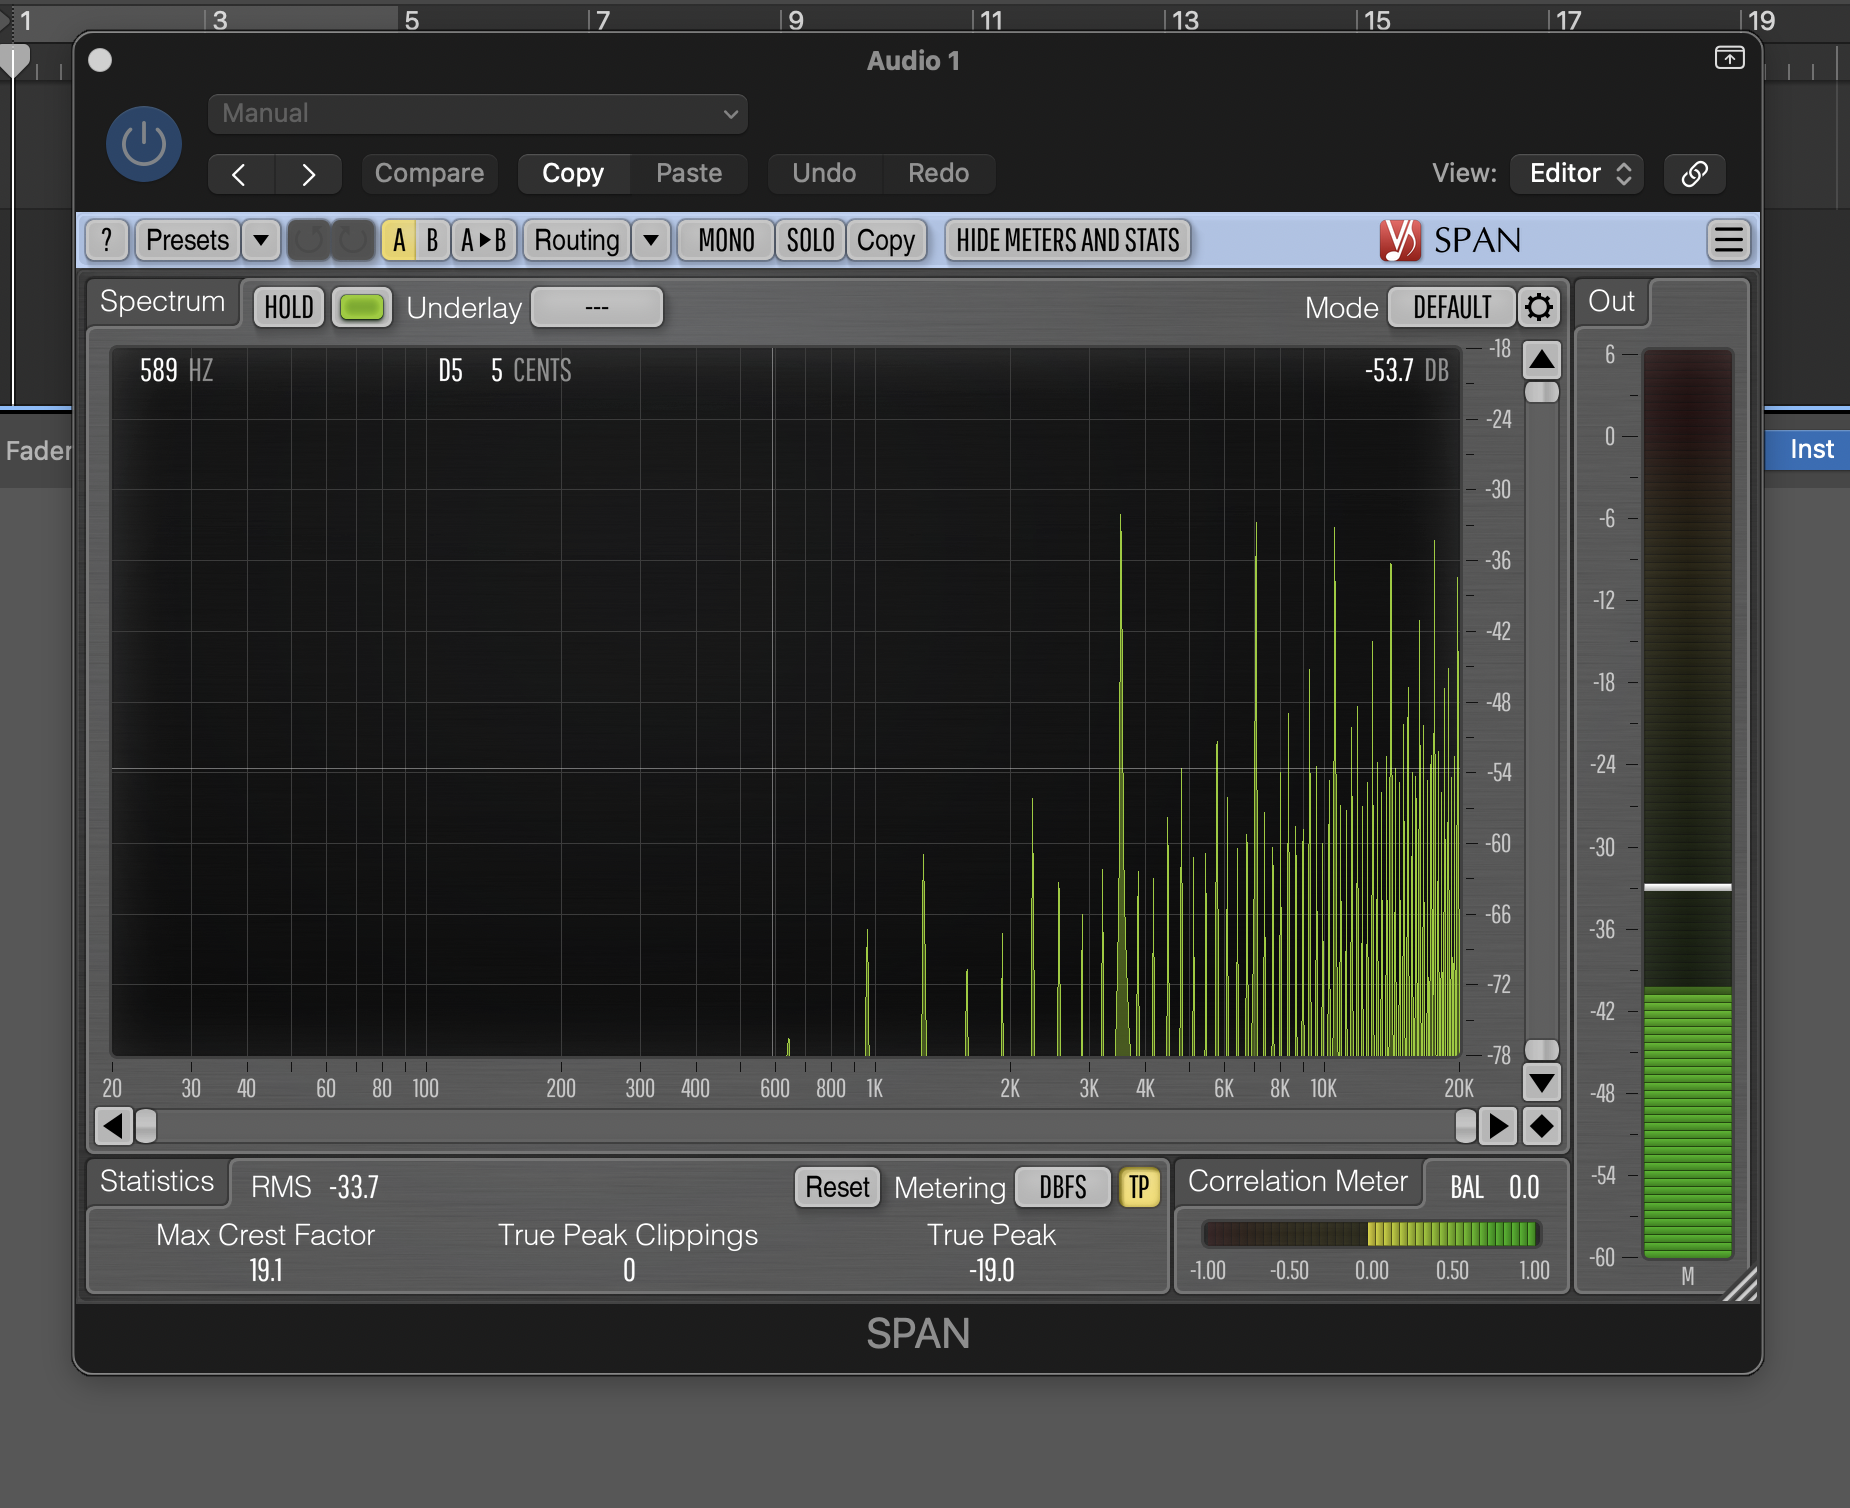
After adding unison, I noticed the high notes on some waveforms had a metallic ringing sound. That’s aliasing. A saw wave has harmonics at every integer multiple of its fundamental, and at a 48 kHz sample rate anything above the 24 kHz Nyquist limit can’t be represented, so it folds back into the lower range. For an A7 saw at 3520 Hz, the fourteenth harmonic is at 49,280 Hz, which folds down to 1280 Hz, below the note itself.
I routed the synth into Logic and looked at it with SPAN. With one unison oscillator on an A7 saw, you can see peaks below the fundamental:
Anti-aliasing algorithms generally smooth out the discontinuities in a waveform, and different waveforms need different corrections. Saw and square use polyBLEP, and the square needs two corrections because it has two jumps per period. After adding polyBLEP, the peaks below the fundamental got much smaller:
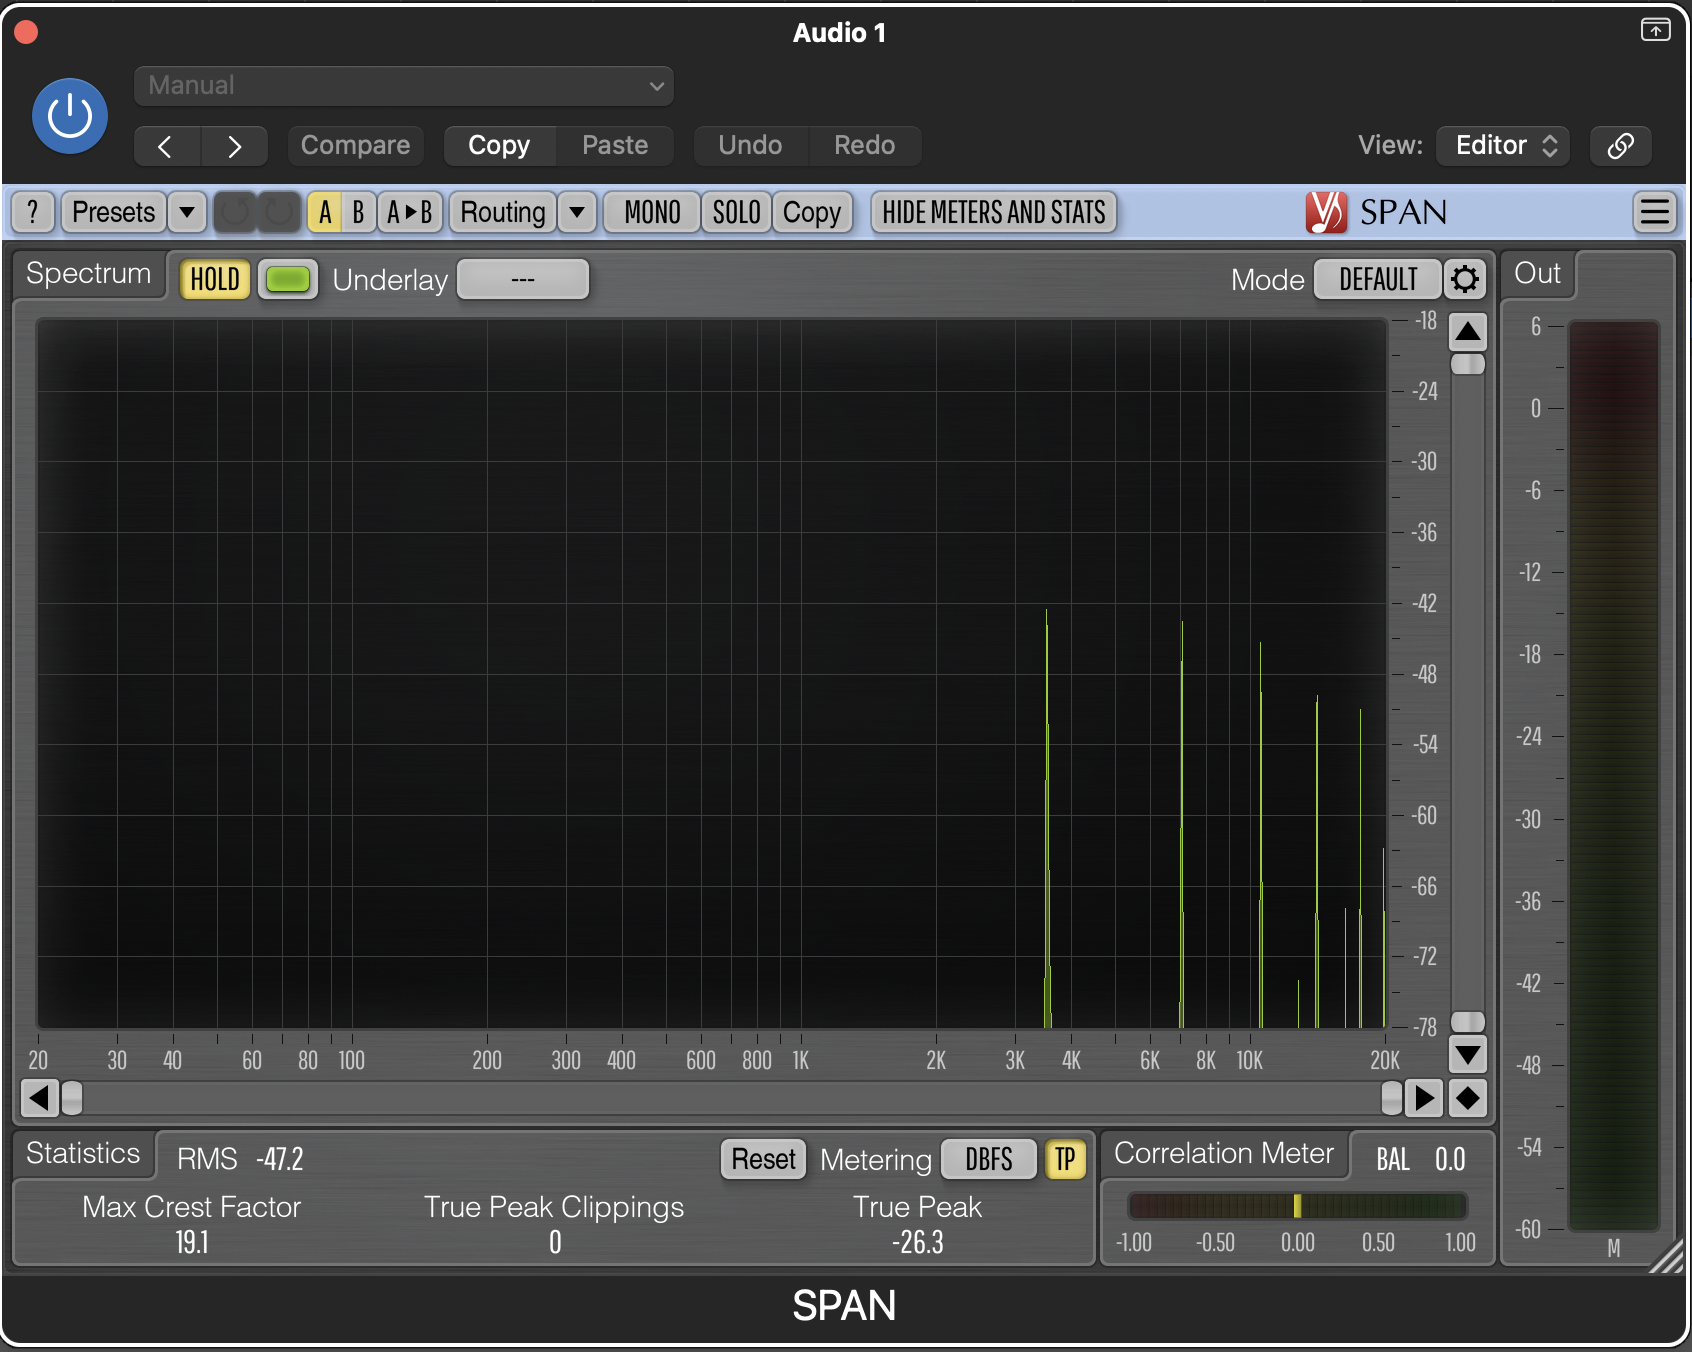
The two plots use different vertical scales, so I’m only using them to show where the peaks are. The triangle uses polyBLAMP, and it still has a frequency below the fundamental starting around E7 (about 2637 Hz). At high notes, its four correction windows can overlap, which messes up the correction.
The nonlinear filter and oversampling
The ladder filter has four stages with feedback from the last stage back to the input, and I saturate each stage with tanh. The feedback makes it circular: the output depends on the current input, but the input depends on feedback from the current output. I solve that with a zero-delay-feedback formulation and Newton’s method. Each iteration runs a candidate input through all four stages, and it stops when the residual is below 1e-6 or after eight iterations. I start each solve from the previous sample’s solution.
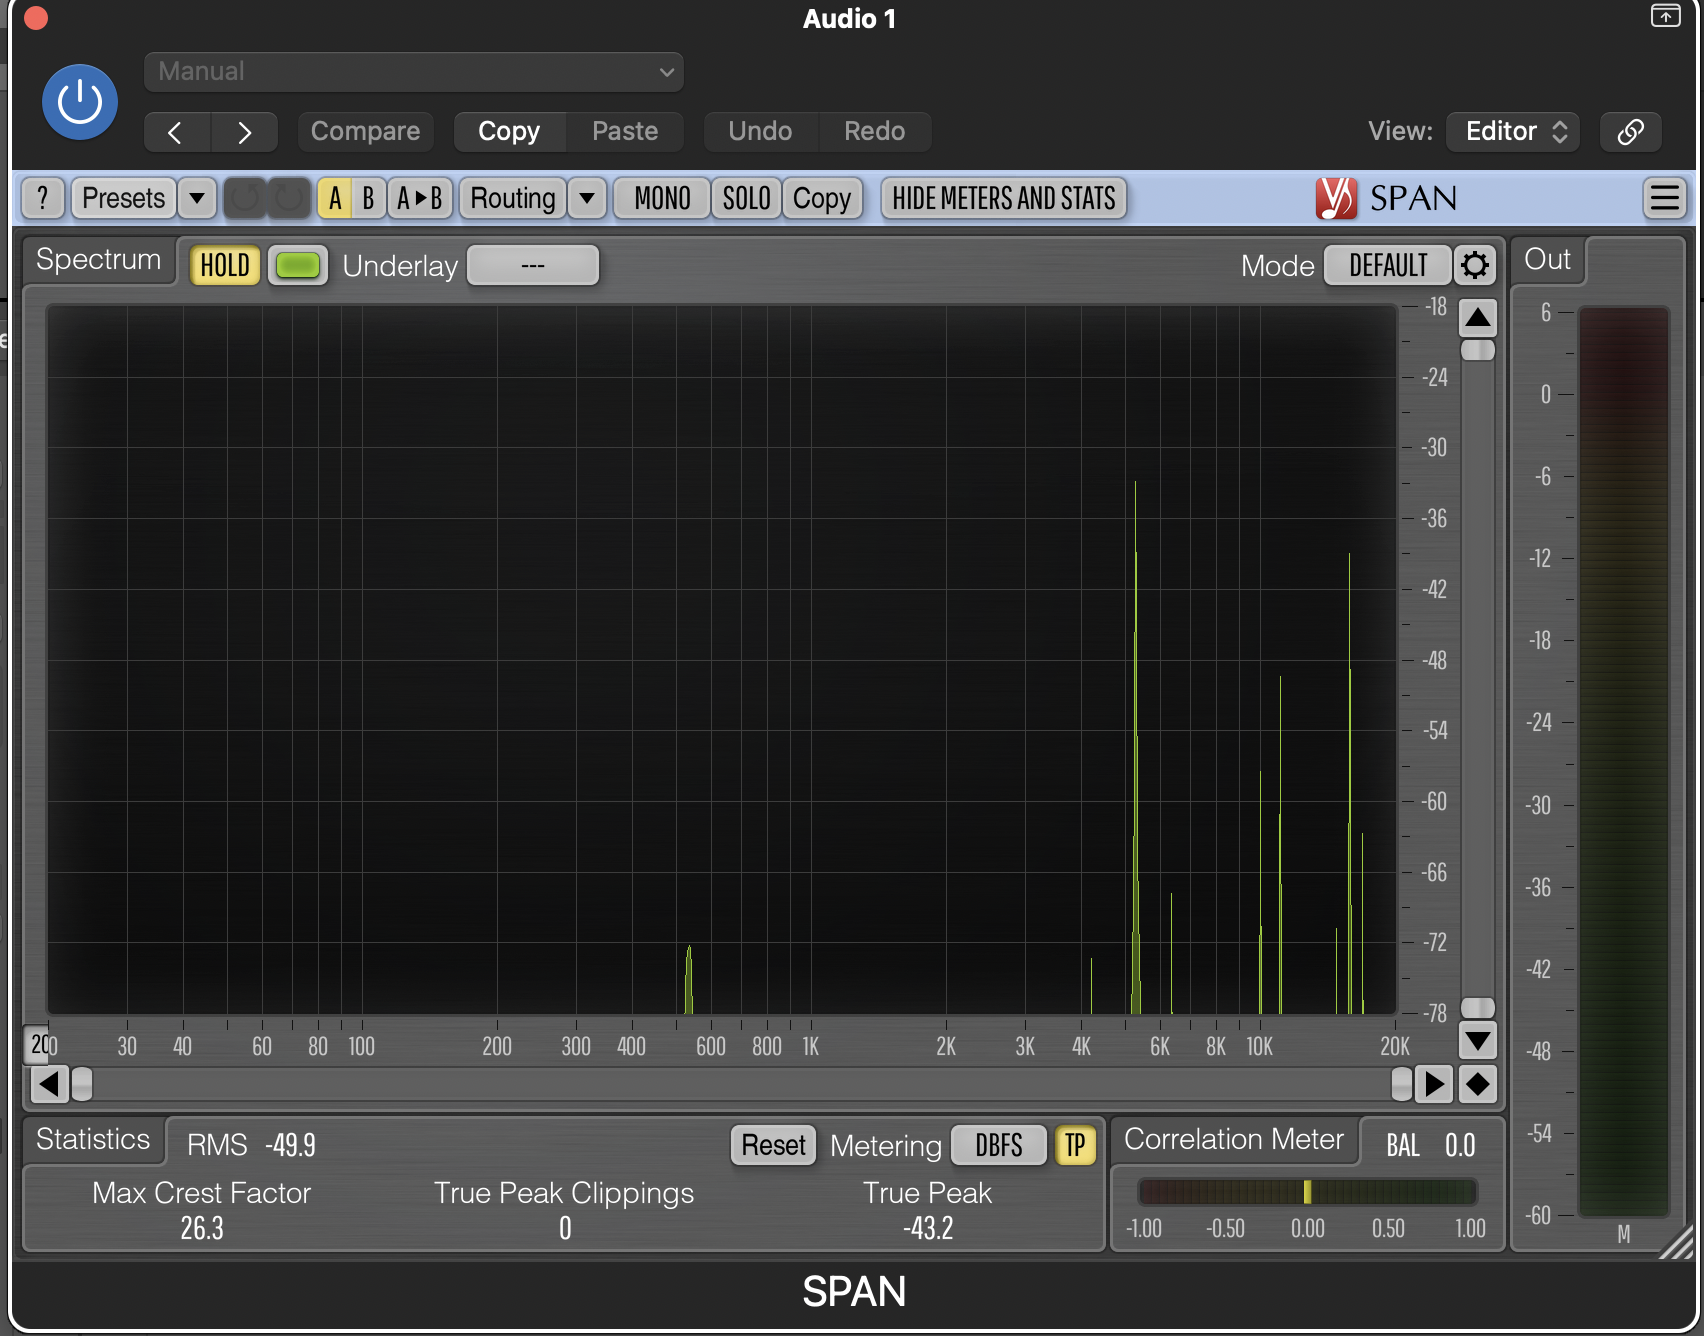
At first I couldn’t see any aliasing from the filter. I wasn’t driving it hard enough. Most of my samples were small for volume reasons, and when the input is small, tanh(u) is approximately u, so it barely did anything nonlinear. I multiplied the samples by 30 before the filter and scaled them back down afterward, and then the aliasing showed up. This is an E7, with frequencies below the fundamental:
That motivated oversampling. The way it works is:
- Generate \(M\) samples for each output sample, where \(M\) is the oversampling factor.
- Run the nonlinear processing at that higher rate.
- Low-pass filter at the original Nyquist frequency.
- Keep every \(M\)th sample.
At 4x, the oscillators and filters run at 192 kHz. The low-pass filter and downsampling step is called the decimator. Envelopes still update once per output frame. The render loop ended up looking like this:
for each output frame:
    update oscillator drift
    for each oversampled step:
        for each voice:
            render and sum its unison oscillators
            normalize, saturate, and add noise
            process left and right ladder filters
            apply voice amplitude and add to the mix
        push the mixed sample into each decimator history
    calculate the retained stereo output
    update envelopes and remove finished voices
Since oversampling repeats everything inside the voice loop, it gets expensive fast. In my first oversampled version, 32 voices took:
| Oversampling | Mean µs/block | p99 µs/block |
|---|---|---|
| 1x | 306.72 | 322.00 |
| 2x | 633.10 | 726.00 |
| 4x | 1209.89 | 1245.12 |
| 8x | 2433.44 | 2550.96 |
At 4x, the 32-voice workload used about 91% of the block budget on average. That left little headroom and made the renderer my next focus.
Measuring the renderer
I made an offline benchmark that calls the same synth_render procedure as the audio callback. It sends Note On events during setup, uses a fixed random seed for the oscillator phases, runs 100 warmup blocks, and then times each measured block with mach_absolute_time. It reports the mean, p50, p99, and the number of blocks over 1333.33 µs. The filter is set to 15 kHz cutoff, 0.9 resonance, and 1.0 drive, and I build with -o:speed (plus -debug for profiling).
I count an offline overrun whenever a measured block takes more than 1333.33 µs. These elapsed times include time the OS spends running other work during the call. The benchmark runs as a normal process and leaves out the live callback’s MIDI handling, so I use it to compare render workloads. A live callback measurement would need its own capture.
For more detail, I used Instruments’ CPU Counters. For the full 32-voice, 4x workload over 5000 blocks, I got about 124 billion instructions and 20.8 billion cycles, which gives an IPC of about 5.94. A scaling benchmark varies one setting at a time and wraps each measured loop in a signpost interval, and a script uses xctrace exports to match the counter samples to each configuration.
Splitting up the loop costs
There are a few nested loops in synth_render, and I wanted to know how much each one contributed. I modeled the total cycles as
where \(F\) is frames per block, \(L\) is the oversampling factor, \(B\) is measured blocks, \(n\) is voices, and \(k\) is unison oscillators. \(a\) is the cost per oscillator iteration, \(b\) per voice per oversampled step (mostly filtering), \(c\) per oversampled step (mostly the decimators), and \(d\) per output frame.
Holding everything else fixed, I swept \(k = 2, 4, 8, 16\) to get \(a\) from the slope, swept \(n = 8, 16, 32\) to get \(ka + b\), and ran zero voices at 1x and 4x to separate \(c\) and \(d\). My first rough estimate from the slopes, at 32 voices and 16 unison, was:
| Work | Cost per item | Share |
|---|---|---|
| Oscillator iteration | 22 cycles | 70% |
| Voice level | 110 cycles | 22% |
| Subframe level | 1150 cycles | 8% |
Later I had a script fit all the runs at once, which put the oscillator cost at 29.3 cycles.
The model treats the costs as additive, and some points were a few percent off the fit. \(d\) also came out slightly negative, which can’t be a real cost. I used the estimates to decide where to look, not as exact costs.
Caching oscillator calculations
The oscillators were doing a lot of work, about 125 instructions per iteration. In theory each oscillator is independent, so I wanted to check the assembly to see whether that independence was being used, and whether anything in the loop could be hoisted out.
Looking at the assembly, the waveform generators and their anti-aliasing code were inlined, and SIMD wasn’t being used. The most expensive line in the oscillator loop was the panning: left_gain := math.cos(pan_angle) and right_gain := math.sin(pan_angle). It accounted for about 8 billion cycles, more than double the next line, which works out to 12.24 cycles per oscillator iteration. To see how much it mattered, I temporarily replaced both with pan_angle, and the mean time per block went from 1230 µs to 830 µs. pan_angle doesn’t change while a note plays, so the loop was computing the same sine and cosine over and over.
The next most expensive line was the frequency calculation, voice.frequency * cents_to_freq_multiplier(detune + drift), at about 3 billion cycles, or 4.62 cycles per iteration. The note’s base frequency and static detuning can be cached; the drift contribution still needs updating. A few other things showed up too: the waveform switch took about 1.5 billion cycles, the saw generation about 1 billion (mostly polyBLEP), and the detune calculation about 900 million, mostly on a ucvtf instruction (42%) and an ldr (56%).
For scale, at 32 voices, 16 unison, 4x oversampling, 64 frames, and 5000 blocks, the oscillator loop runs
\[32\cdot16\cdot4\cdot64\cdot5000=655{,}360{,}000\]times, so anything small in that loop adds up quickly. I cached each oscillator’s frequency, pan angle, left and right gains, and phase step on note_on, so panning became just two multiplies. I also had to update code that changed those values after note setup: my alias tool set voice.frequency, but the oscillators kept their cached frequency until I fixed it.
| Oversampling | Mean before, µs/block | Mean after, µs/block | p99 after, µs/block |
|---|---|---|---|
| 1x | 306.72 | 121.64 | 133.71 |
| 2x | 633.10 | 239.32 | 267.12 |
| 4x | 1209.89 | 519.33 | 1334.46 |
| 8x | 2433.44 | 976.53 | 1005.50 |
The fitted oscillator cost went from 29.3 to 7.7 cycles. The 4x run still had 11 overruns in 1000 blocks, though, so its p99 was over budget even with a mean under half of it. That run didn’t explain the long blocks; I investigated the timing variability later.
Replacing tanh
Caching brought the 4x workload down to 519.33 µs per block. I then added saturation in every ladder stage, oscillator drift, a saturating mixer, and noise. With those features, mean render time rose to 1127.36 µs. This expanded workload is the baseline for the next optimization, and filtering now accounted for most of the work:
| Work | Cost per item | Share |
|---|---|---|
| Oscillator iteration | ~10 cycles | 27% |
| Voice level | ~400 cycles | 63% |
| Subframe level | ~1000 cycles | 5% |
ladder_filter_process was now 53.3% of the total cycles. Inside ladder_forward, tanh calls accounted for about 5 of its 12 billion cycles, so the first thing I tried was a fast approximation:
fast_tanh :: proc(x: f64) -> f64 {
    x2 := x * x
    return x * (27 + x2) / (27 + 9 * x2)
}
Checking the microbenchmark
Before switching, I wanted to know how many cycles each version took. My first results were pretty suspicious: fast_tanh took exactly as many “cycles” as reading the cycle counter. It turned out I was running without optimizations, and my volatile loads and stores had some overhead. After fixing that, fast_tanh came out at 0.68 cycles per call, which was honestly even more suspicious.
I looked at the assembly in lldb, and the counter read was:
mrs x20, CNTVCT_EL0
CNTVCT_EL0 is ARM’s virtual timer count, which isn’t the same as CPU cycles. Using intrinsics.read_cycle_counter_frequency(), I found the counter runs at 1 GHz, so I switched everything to nanoseconds. Sweeping the input over 50,000 iterations gave:
| Input | math.tanh, ns/iteration |
fast_tanh, ns/iteration |
|---|---|---|
| 0.1 | 2.980 | 0.673 |
| 0.6 | 2.954 | 0.683 |
| 0.7 | 7.456 | 0.636 |
| 1.0 | 8.984 | 0.678 |
tanh jumps between 0.6 and 0.7, and in the assembly I saw that Odin switches to a different calculation for values above 0.625.
Predicting the speedup
fast_tanh was at least 4x faster in the microbenchmark, but I didn’t expect quite that much in the filter. The microbenchmark lets independent calls overlap, while in the ladder each stage depends on the last. fast_tanh still has an fdiv, which I read has a latency of about 14 cycles. fast_tanh came out to around 3-5 cycles per call (assuming 4.4 GHz) and tanh about 40, so I thought the filter would mostly be latency bound after switching. The slow throughput of tanh had probably been hiding most of that latency. Going from about 40 cycles to 14, I predicted about 60% fewer cycles for the tanh work.
The measured reduction was about 53% for the tanh operations, a little below my prediction. Total cycles dropped to about 15 billion with about 60 billion instructions, an IPC around 4. On the full renderer:
| Nonlinearity | Mean µs/block | p50 µs/block | p99 µs/block | Overruns |
|---|---|---|---|---|
math.tanh |
1127.36 | 1128.75 | 1173.17 | 0/5000 |
fast_tanh |
639.95 | 637.17 | 683.58 | 0/5000 |
That’s about a 1.76x speedup. It does change the filter’s sound, though, and the Newton step still uses 1 - t*t as the derivative, which is exact for tanh but not for fast_tanh. I still need to check residuals and convergence before treating it as a drop-in replacement. A wrong derivative can also make Newton’s method take more iterations, so I want to log iteration counts before and after fixing it.
ladder_forward was still slow, with each iteration depending on the last. I suspected further gains would need an algorithm change, so I left that for later.
A change I couldn’t explain
I ran the scaling benchmark again, and both the voice and oscillator costs dropped. The oscillator cost dropped by half, from about 10.7 to 5.4 cycles. I hadn’t expected a filter change to affect it that much.
In Instruments, something looked very wrong. With fast_tanh, synth_render’s call to oscillator_advance_phase went from 2.5 billion cycles (10.4% of synth_render) to less than 10 million (0.1%). That call only runs if audible is true, and audible comes from the voice’s amplitude, which only the envelope controls. I suspected something was messing with audible, even though fast_tanh is only used inside the filter. I checked it and didn’t find a problem, so I moved on.
Later, I checked the disassembly of the current build, which uses fast_tanh. There’s no separate oscillator_advance_phase function in it at all, and synth_render never calls one, so the compiler inlined it. Instruments would then count those cycles under synth_render instead of oscillator_advance_phase, which would explain the drop. My guess is that the math.tanh build still called it as a separate function, but I haven’t rebuilt that version to check.
Trying more accumulators
The next thing I looked at was the oscillator loop:
for osc_idx in 0 ..< synth.unison_count {
    osc := &voice.oscillators[osc_idx]
    voice_sample += oscillator_render(osc, synth.waveform)
    if audible {
        oscillator_advance_phase(osc)
    }
}
Each oscillator can be computed independently before summing the results, so I thought I could vectorize the loop. First, I tried four accumulators to check whether repeatedly adding to the same voice_sample was limiting performance.
| Variant | Mean µs/block |
|---|---|
| One accumulator | 643 |
| Four accumulators | 669 |
| Four accumulators, forced inline | 646 |
With four accumulators, it got slower. Looking at the assembly, the compiler had stopped inlining oscillator_render and was saving values to the stack between calls:
bl   "_mohg::oscillator_render"
...
str  q0, [sp, #192]
str  q1, [sp, #144]
bl   "_mohg::oscillator_render"
After forcing it to inline, the four-accumulator version was about the same as one accumulator. That gives me little evidence that the accumulation dependency is limiting performance in this configuration. I also found some packed SIMD instructions, like fmul.2d v0, v1, v0[0], but that one just multiplies one oscillator’s sample by its left and right gains. The waveform math still runs one oscillator at a time, so vectorizing across oscillators is still open.
Calculating outputs I threw away
After the accumulator experiment, I looked at the decimator, which still accounted for a few billion sampled cycles. The before/after timings below come from a separate pair of runs.
My decimator is a 257-tap FIR low-pass filter. FIR means each output is a weighted sum of the most recent inputs, and a tap is one weight times one input. I use a Hamming-windowed sinc with a 21 kHz cutoff for the weights, and each channel keeps its last 257 inputs in a circular buffer:
for k in 0 ..< FIR_TAPS {
    idx := d.write - 1 - k
    if idx < 0 {
        idx += FIR_TAPS
    }
    result += d.coeffs[k] * d.history[idx]
}
I noticed that I called decimator_output on every oversampled step but only kept the result on the last one. At 4x, I was calculating four outputs per channel and throwing three away. decimator_output doesn’t change any state, so I could push every sample but only calculate the output on the last step:
push_decimator(oversample, &synth.left_decimator, &synth.right_decimator)

if i == synth.oversampling_factor - 1 {
    oversample = apply_decimator(
        oversample,
        &synth.left_decimator,
        &synth.right_decimator,
    )
}
For a 64-frame stereo block at 4x, that goes from 512 FIR outputs to 128. Arm’s CMSIS-DSP FIR decimator does the same thing. decimator_output had been 10.9% of the cycles, so removing 75% of it works out to about 8.2% if nothing else changed.
| Decimator | Mean µs/block | p50 µs/block | p99 µs/block | Overruns |
|---|---|---|---|---|
| Output every oversampled step | 723.34 | 716.17 | 759.67 | 0/5000 |
| Output only on the last step | 668.48 | 661.17 | 705.96 | 0/5000 |
The mean fell by 54.86 µs, about 7.6%. In Instruments, decimator_output went from about 1.43 billion cycles to 0.35 billion. The total cycle counts came from unmatched capture conditions, so I’m using elapsed time for the overall comparison. Since calculating an output doesn’t change any state, the outputs I keep should be identical to before, but I haven’t compared them sample by sample yet.
Final performance and capacity
The optimizations made my 32-voice workload faster, but I also wanted to know how much more work would fit. I increased the voice count while keeping 16 oscillators per voice, and repeated the sweep at 1x, 2x, and 4x oversampling.
At 4x, 32 voices averaged 0.67 ms per block, about half the 1.33 ms budget. More voices meant more work, until the average reached the budget at roughly 59 voices, compared with 35 voices before caching. I estimated these crossing points between neighboring measurements:
| Oversampling | Initial version | Final sweep |
|---|---|---|
| 1x | ~119 voices | ~117 voices |
| 2x | ~67 voices | ~78 voices |
| 4x | ~35 voices | ~59 voices |
These are limits based on average render time, not guaranteed glitch-free voice counts. I also added saturation, drift, and noise during development, so the comparison includes both new features and optimizations. At 1x the net capacity barely changed; at 4x it increased by about 24 voices.
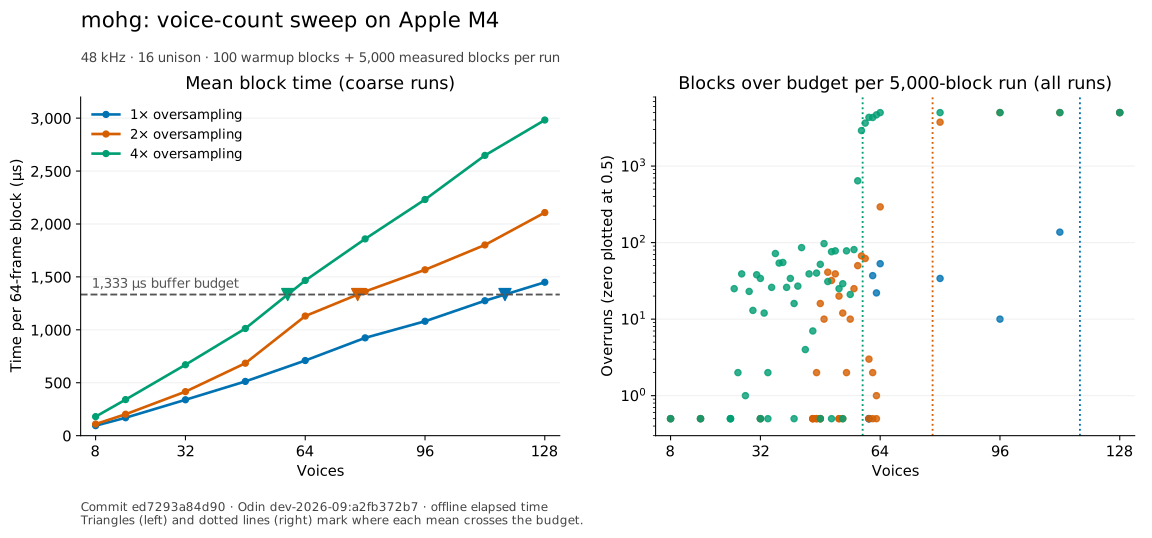
The left plot shows average cost. The right shows a different problem: some blocks exceeded the deadline even when the average was below it. Each run measured 5000 blocks after 100 warmup blocks, using the same optimized executable and a fixed random seed, with chorus off. I’ll return to those overruns after the sound-quality comparison.
The quality/cost tradeoff
Oversampling repeats expensive processing, so I wanted to check whether the extra work removed enough aliasing to justify it. I compared a sine, whose distortion mainly comes from the nonlinear processing, with a saw, which also has residual oscillator aliasing.
I measured energy at frequencies where high harmonics would fold back into the audible range, relative to the fundamental. More-negative dB values mean less energy at those frequencies. Counting only those frequencies helped avoid confusing the synth’s added white noise with aliasing.
| Oversampling | 5 kHz sine, dB | 3.52 kHz saw, dB | Render time, ms/block |
|---|---|---|---|
| 1x | -51.6 | -29.9 | 0.339 |
| 2x | -68.9 | -38.3 | 0.416 |
| 4x | -73.7 | -44.9 | 0.670 |
The quality measurements use one sustained voice with drive 4, a 20 kHz cutoff, and no resonance. The timing column uses the separate 32-voice benchmark workload. It shows the processing cost, not the time taken by the quality test.
For the sine, 2x provided most of the measured improvement. The saw gained another 6.6 dB of suppression going from 2x to 4x, at a cost of about 61% more render time in the benchmark. That makes the choice depend on the sound. These tests cover only one frequency per waveform, so they aren’t enough to choose a default for every note and drive setting.
The tool uses a 65,536-sample Hann-windowed FFT with the tone aligned to a frequency bin, and checks an 8x-output-rate reference as a rough floor.
Why average performance was not enough
Audio needs each block on time. A fast average can hide occasional slow blocks, so I also searched for voice counts that completed three consecutive runs without exceeding the budget. This wasn’t an exhaustive search, and the result was inconsistent: at 4x, 48 voices passed one run, while 32 voices failed a later one. Lowering the workload didn’t reliably eliminate overruns.
I wanted to distinguish two possible contributors. Sustained work could heat the fanless MacBook Air enough to reduce its clock speed. Separately, the OS could pause the benchmark to run other work. My timer measures elapsed time, so it includes both computation and time spent waiting to run.
I recorded individual block durations and ran the same 32-voice, 4x workload 48 times:
- Rested versus sustained runs: the first eight runs each followed a 45-second pause; the remaining 40 ran back to back. This tested whether sustained load changed the timing. The pauses were intended to let the machine cool, not a measurement of chip temperature.
- Default versus elevated QoS: I alternated the thread’s scheduling priority throughout both groups. QoS tells macOS how urgently to schedule the work; it doesn’t reserve the CPU or guarantee a deadline. Alternating the settings reduced the chance of confusing a priority effect with the machine getting warmer over time.
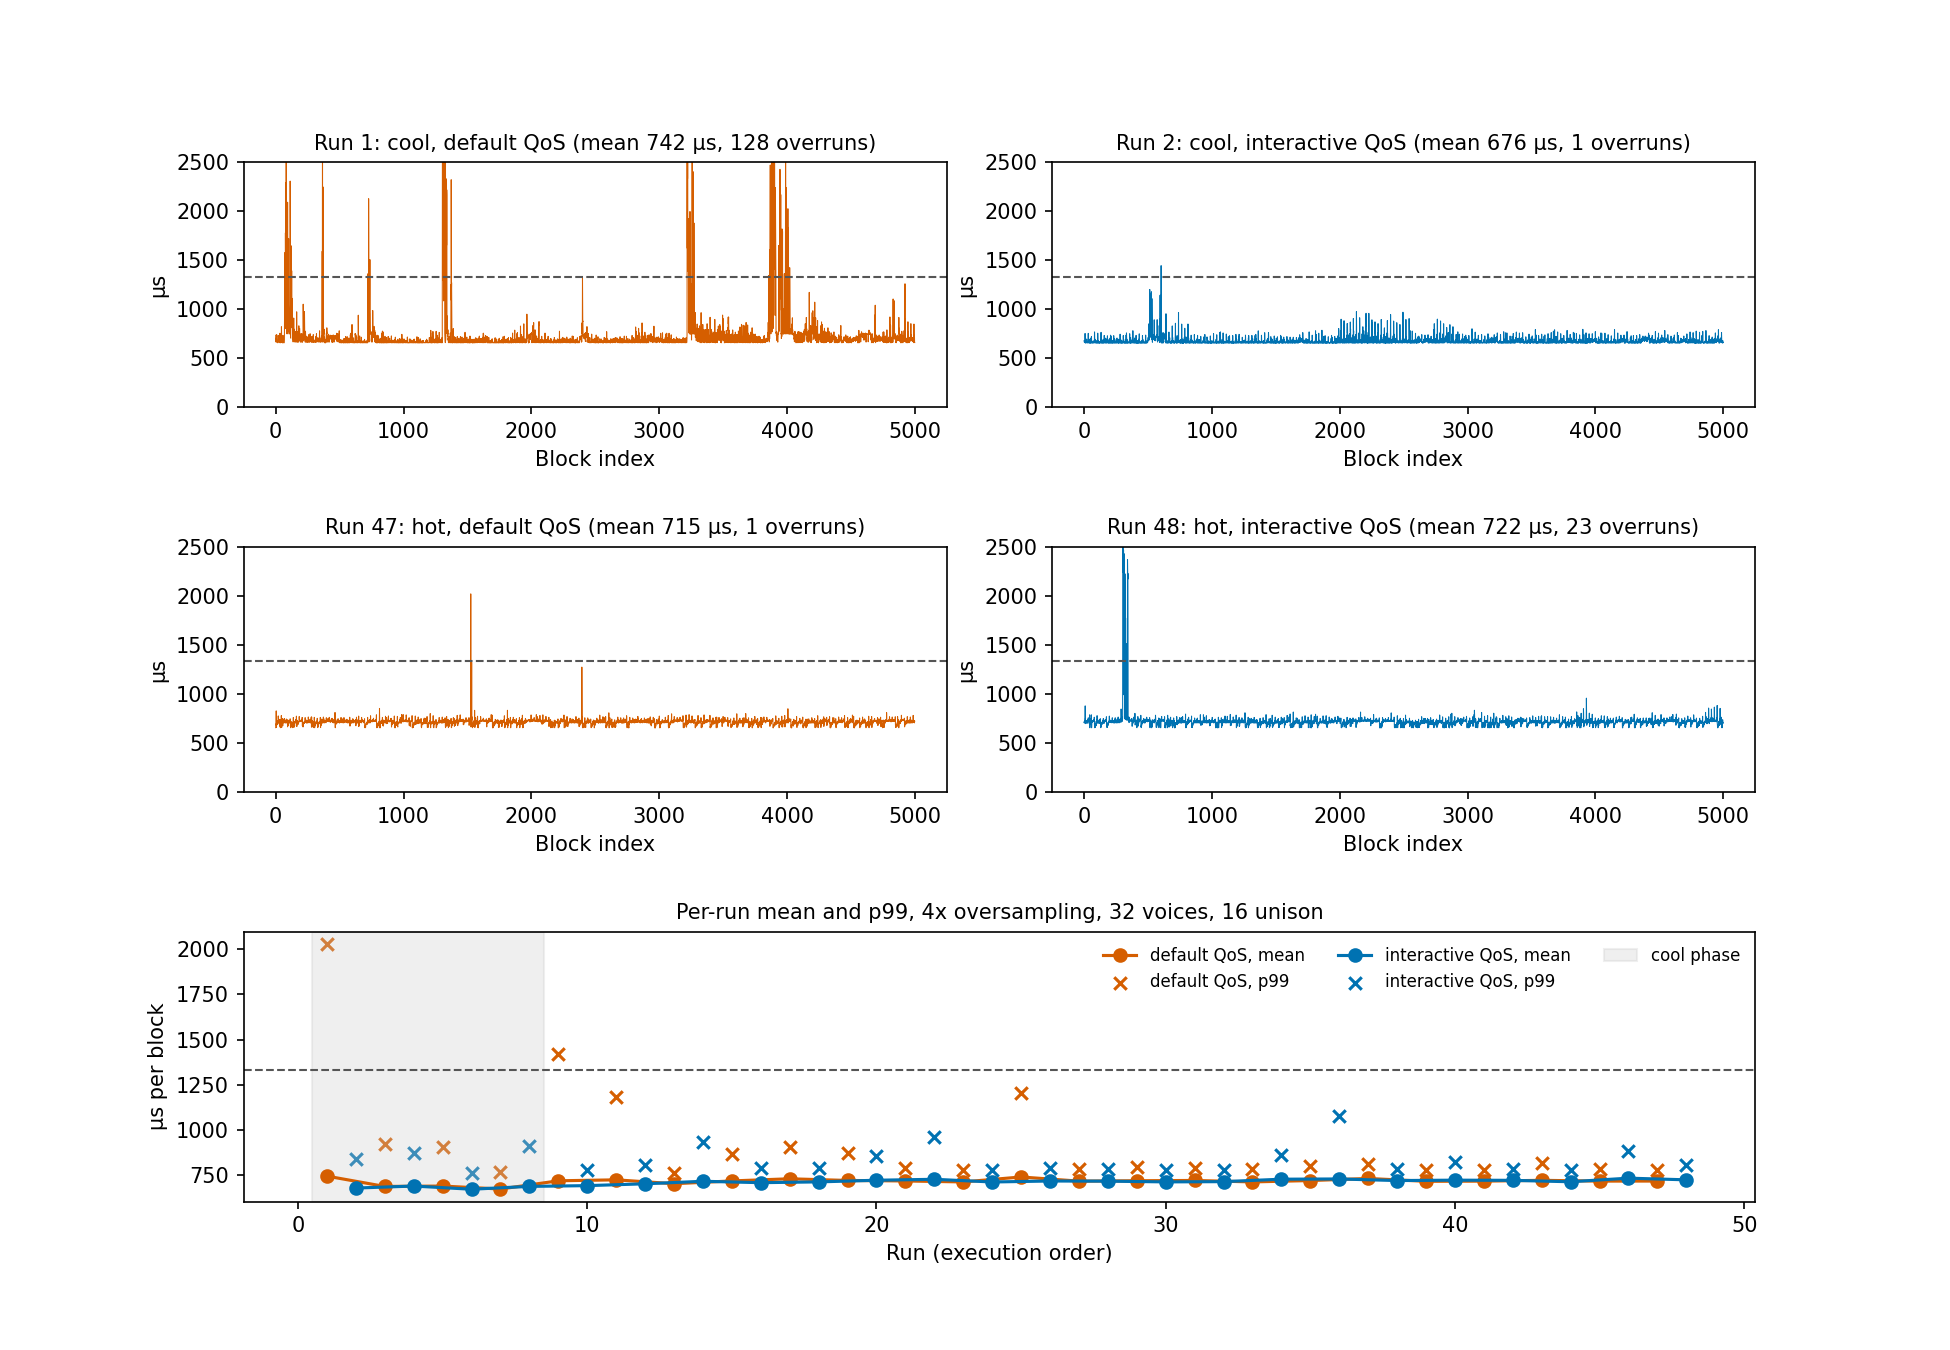
Typical block time rose from about 0.66 ms to 0.715 ms, an 8% slowdown. But the overruns included bursts of 2–3.5 ms blocks, far larger than that shift. The thermal log recorded no events; this doesn’t rule out thermal effects, but the modest shift in typical timing alone doesn’t explain the bursts.
Higher QoS didn’t consistently solve the problem either. Across the sustained runs, default QoS had 255 overruns and elevated QoS had 234. The rested runs were too variable to draw a strong conclusion. The cause remains unresolved, and these are offline budget overruns, not measurements of live playback glitches.
Next steps
I want to find out where the thread spends its time during the slow bursts. A scheduler trace could distinguish time spent waiting to run from time spent executing. I also want to test a real-time scheduling policy and measure the live CoreAudio callback, since the offline benchmark doesn’t reproduce its scheduling conditions.
The tanh approximation needs convergence checks: it changes the filter’s response, and the Newton solver still uses the derivative of the original function. More notes and drive settings would also help establish when the extra cost of 4x oversampling is worthwhile.